
INTERFACE / IIS MONITOR 3
See the software.
Explore the detail.
A look at the desktop monitoring workflow, from server overview to selected-site activity and the content behind your traffic.
ACTUAL APPLICATION CAPTURES
From the overview
to the busiest URL.
Explore the current IIS Monitor 3.0.20 interface, captured during live monitoring. Select any image to enlarge it.
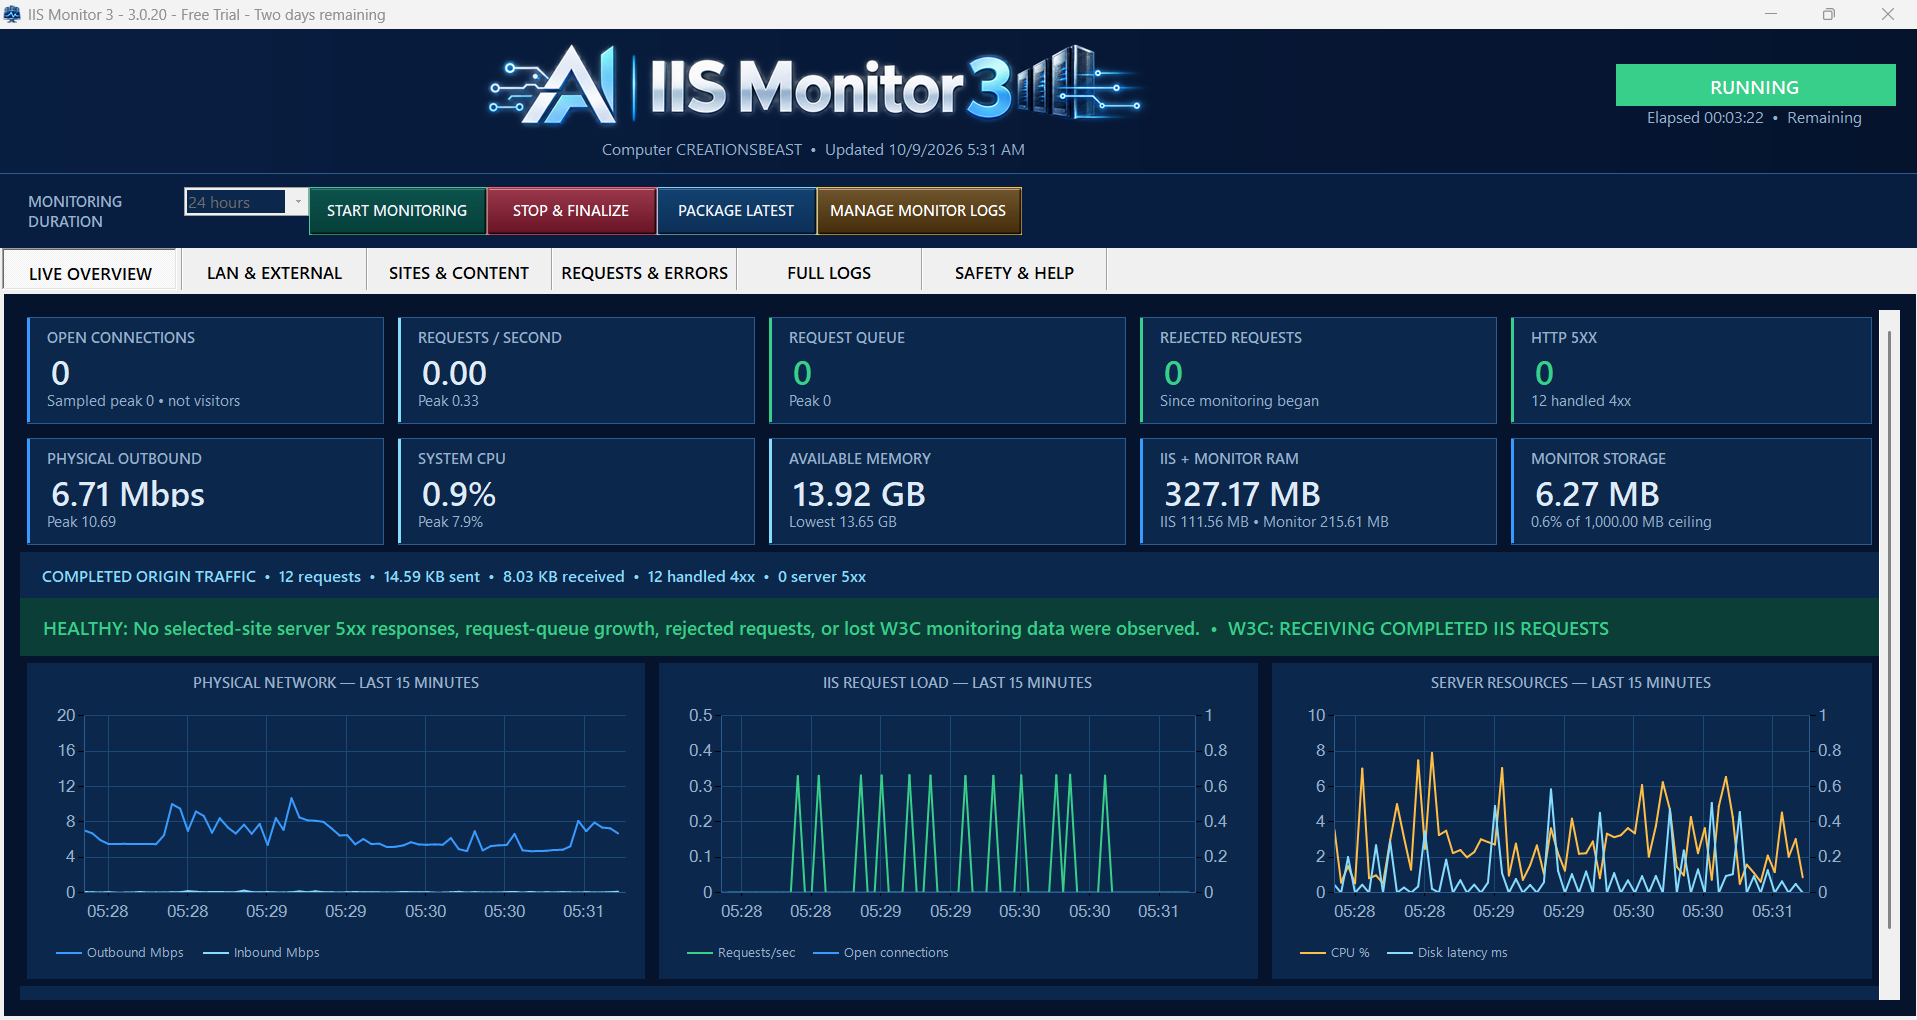
Live Overview
Live Overview brings server traffic, IIS activity and resource measurements into one view.
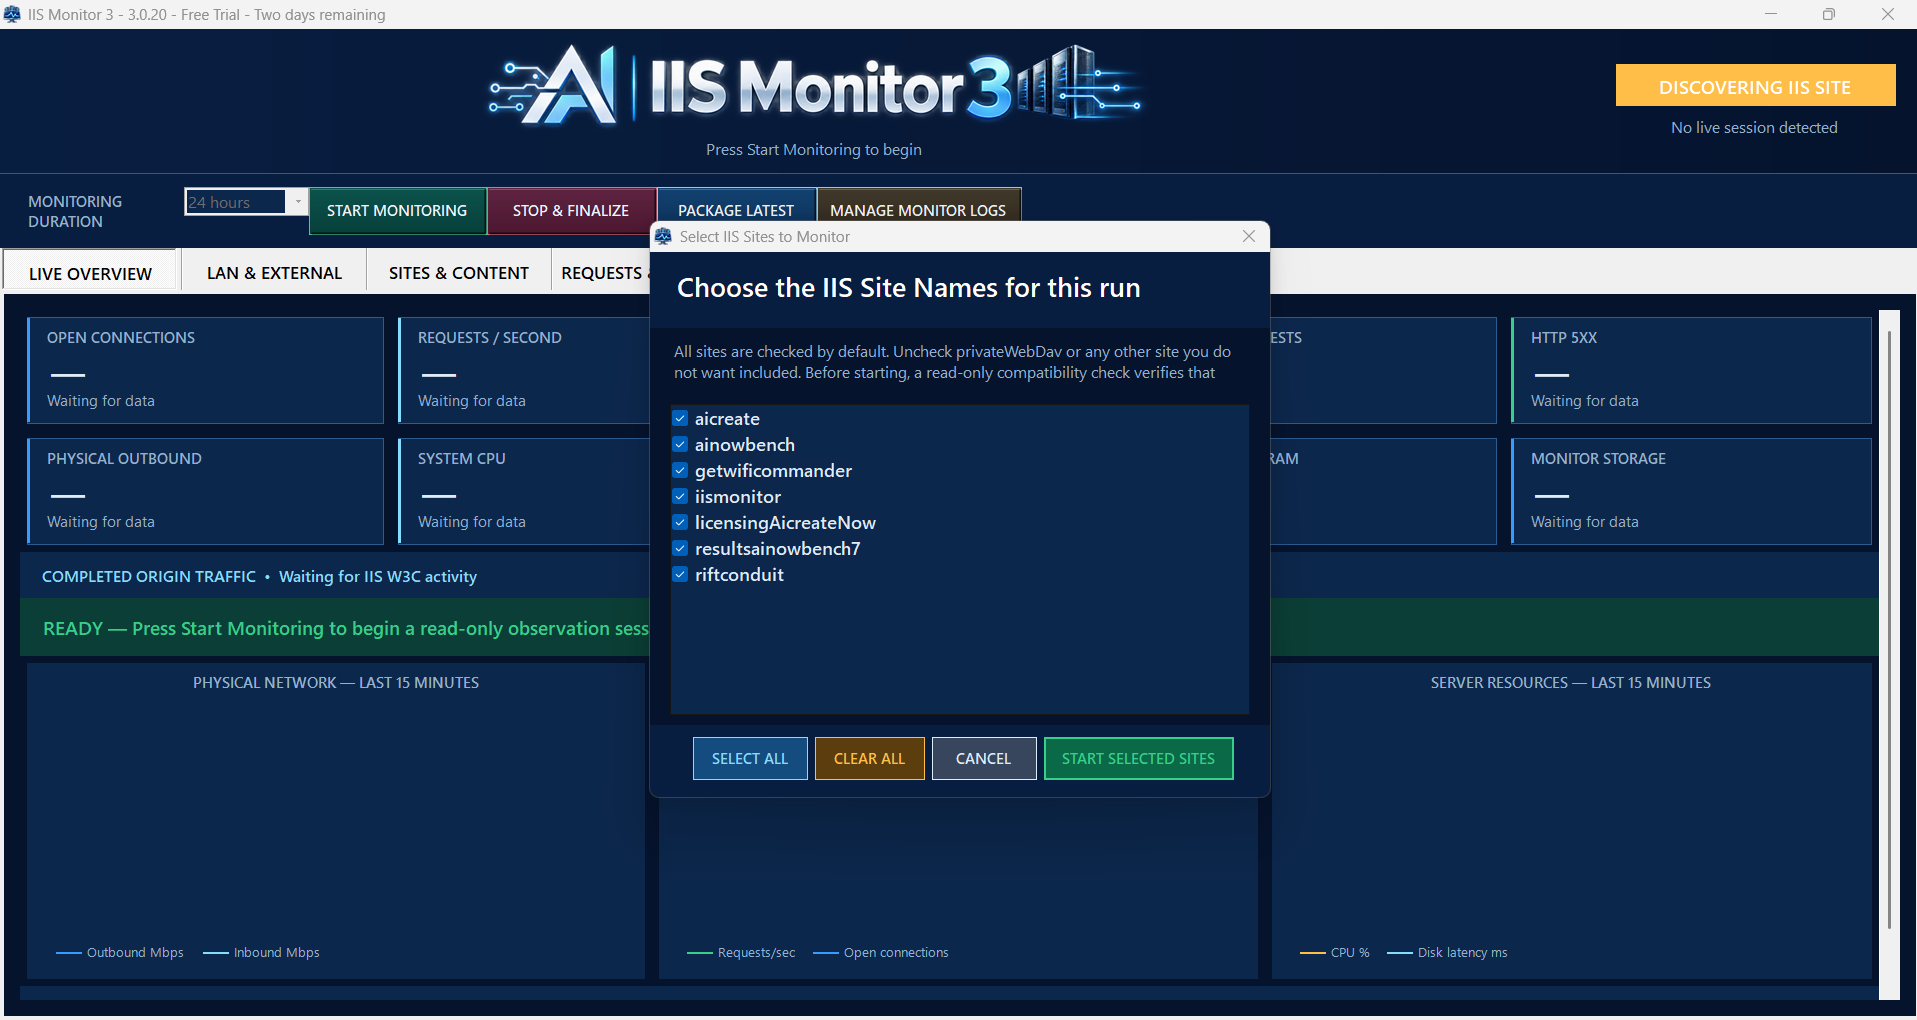
Select IIS Sites
Choose which IIS sites to include before starting a recording.
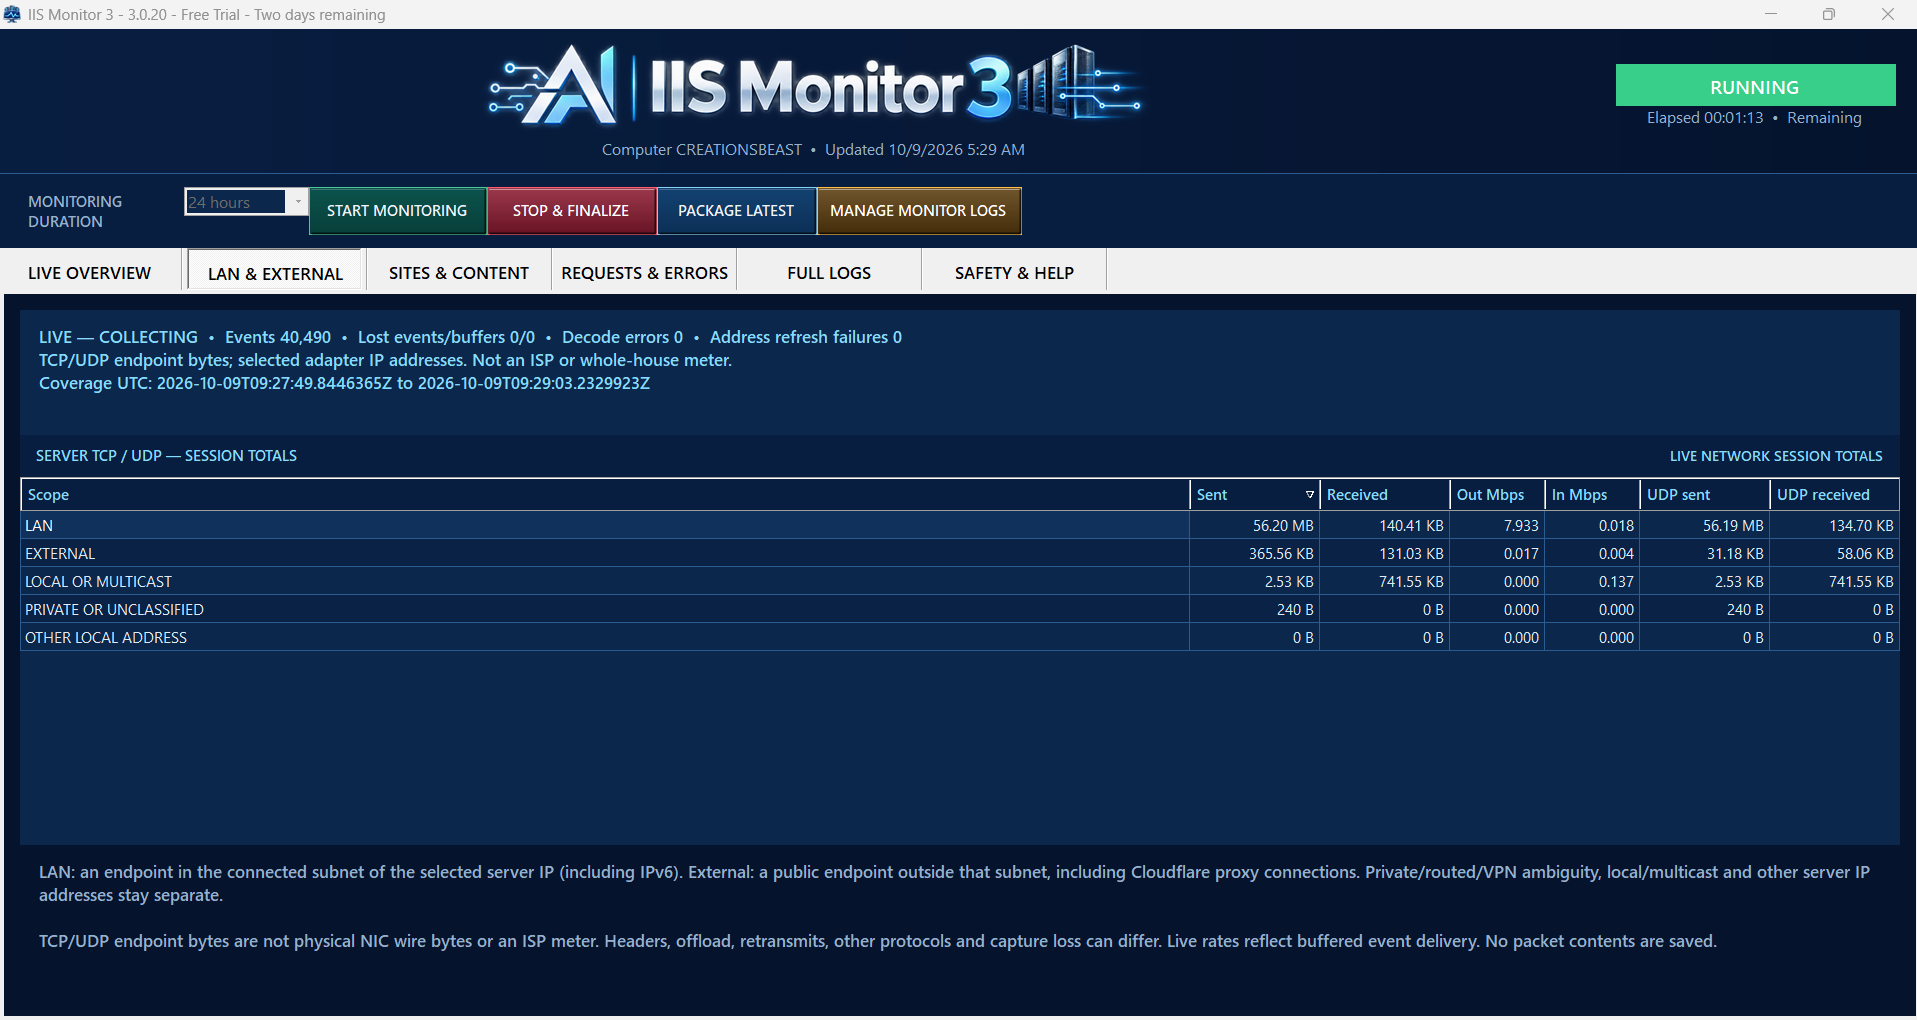
LAN & External
Separate LAN and public external endpoint traffic, with coverage and ambiguity visible.
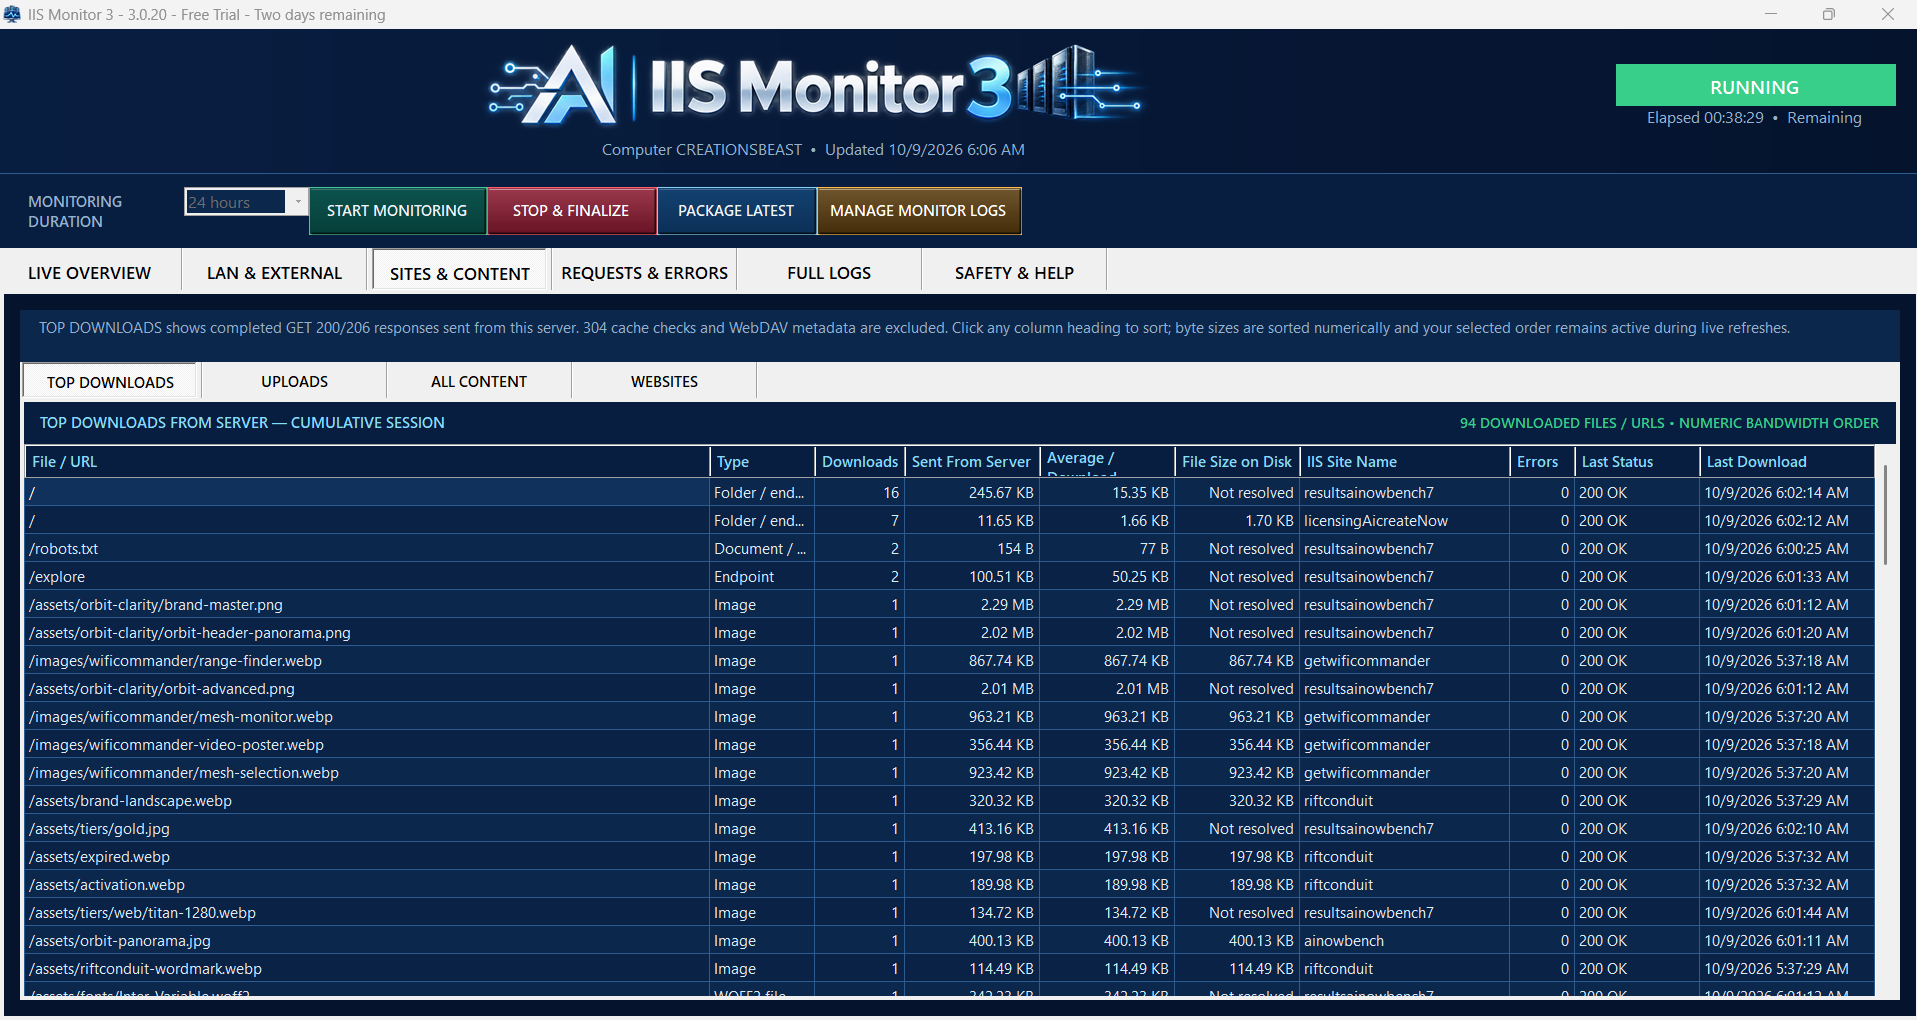
Top Downloads
See which completed downloads account for your origin's outgoing traffic.
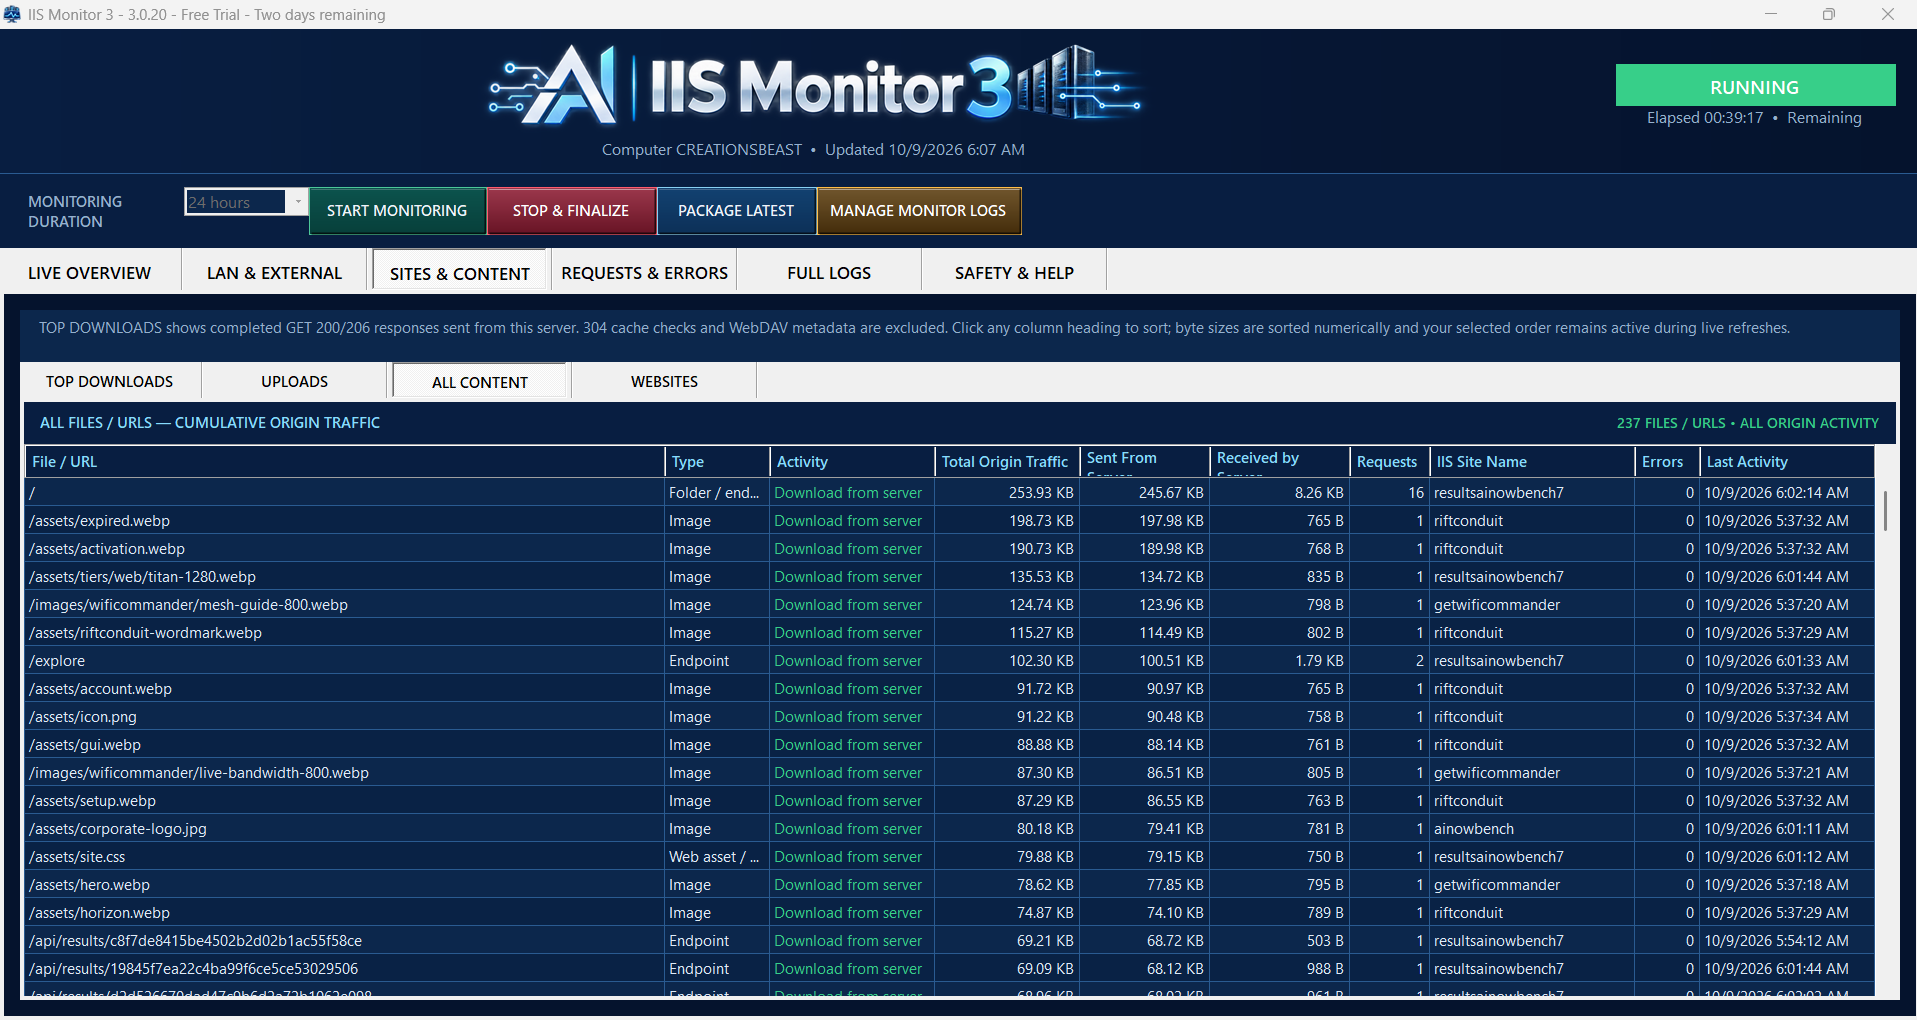
All Content
Review cumulative traffic across files, URLs and API endpoints.
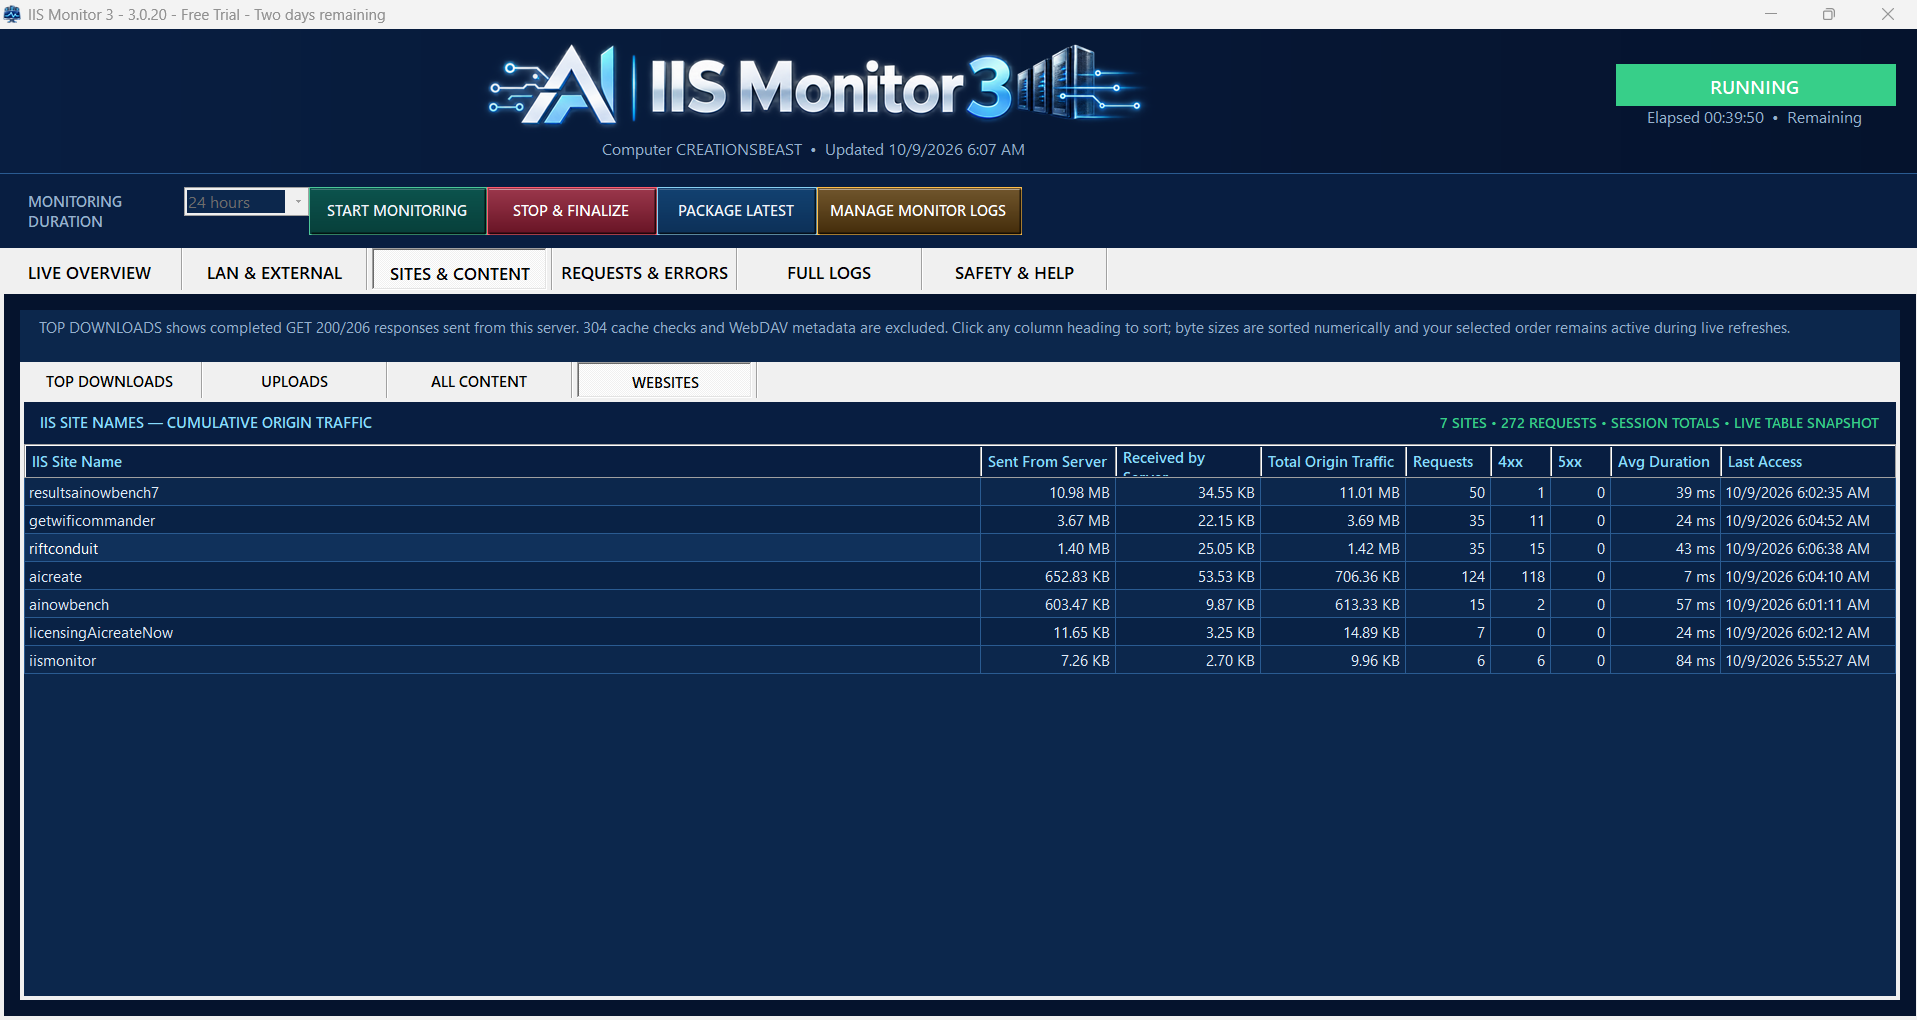
Websites
Compare origin traffic, request totals and HTTP status counts across selected IIS sites.
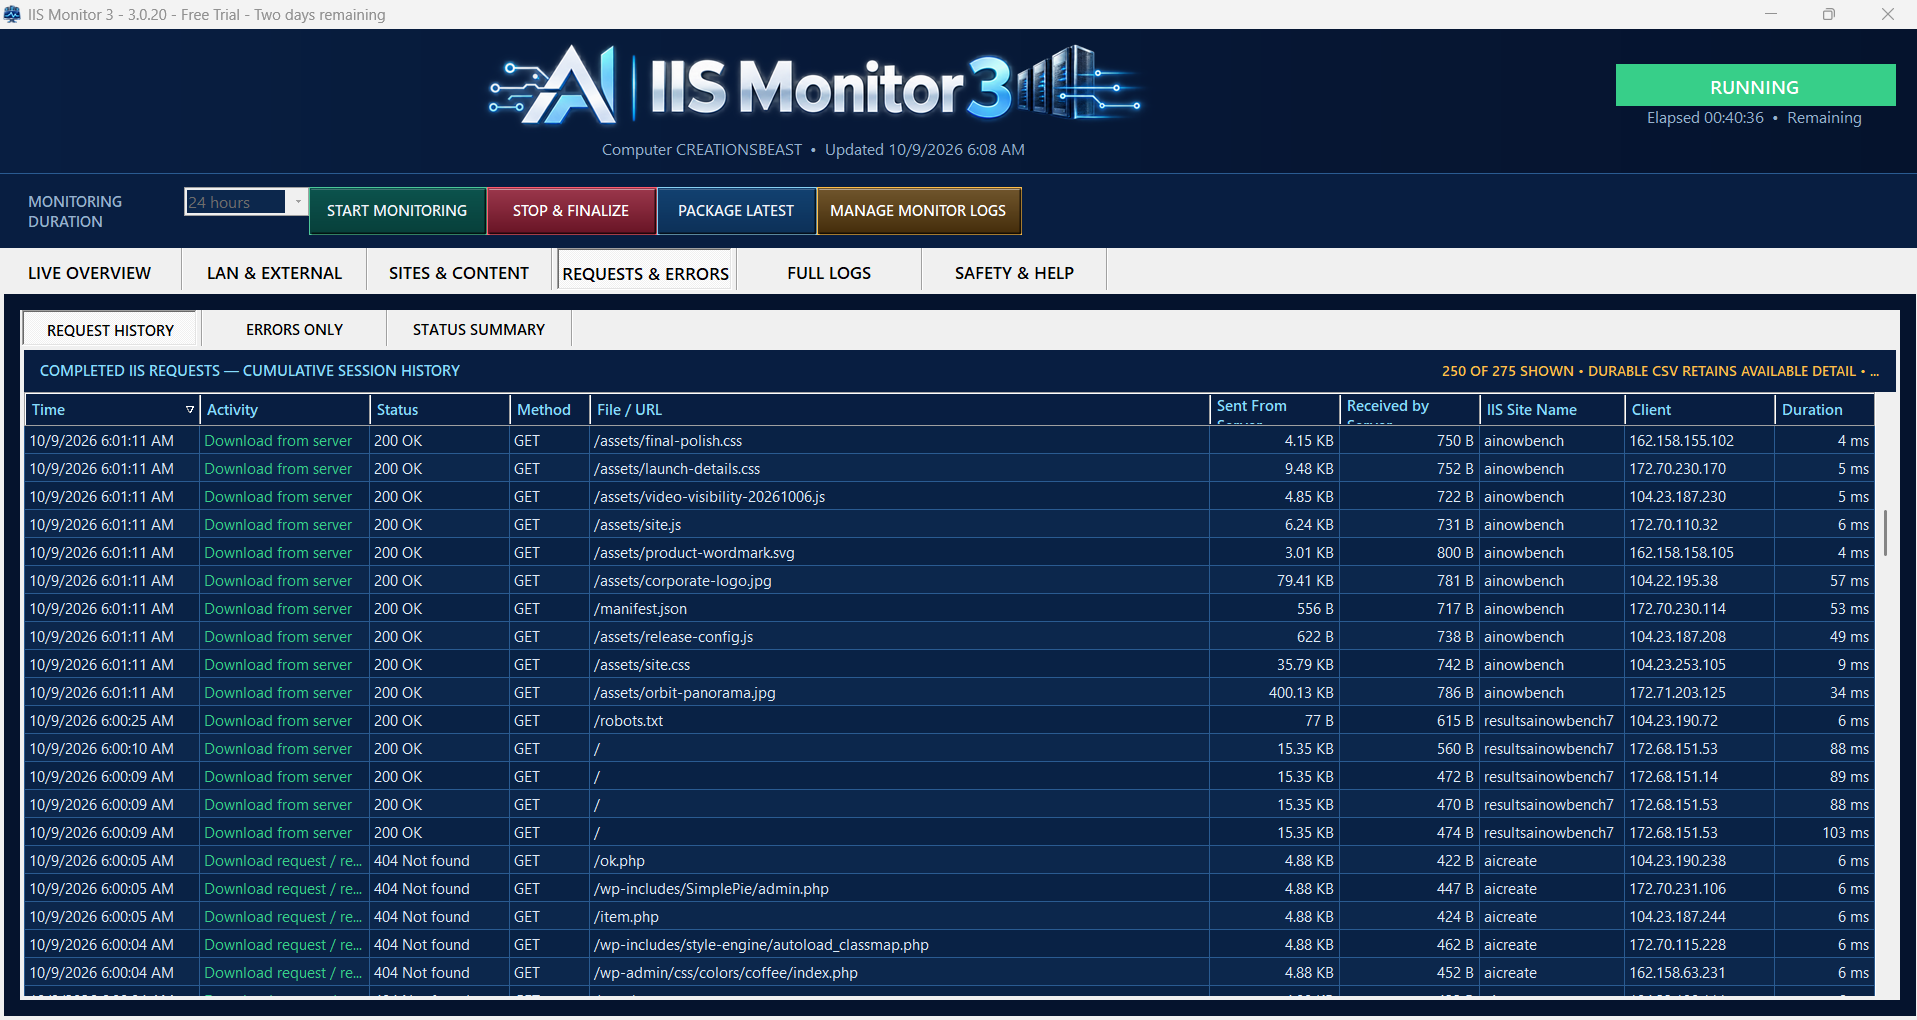
Request History
Inspect completed requests with HTTP status, method, byte counts, logged client or proxy address, and duration.
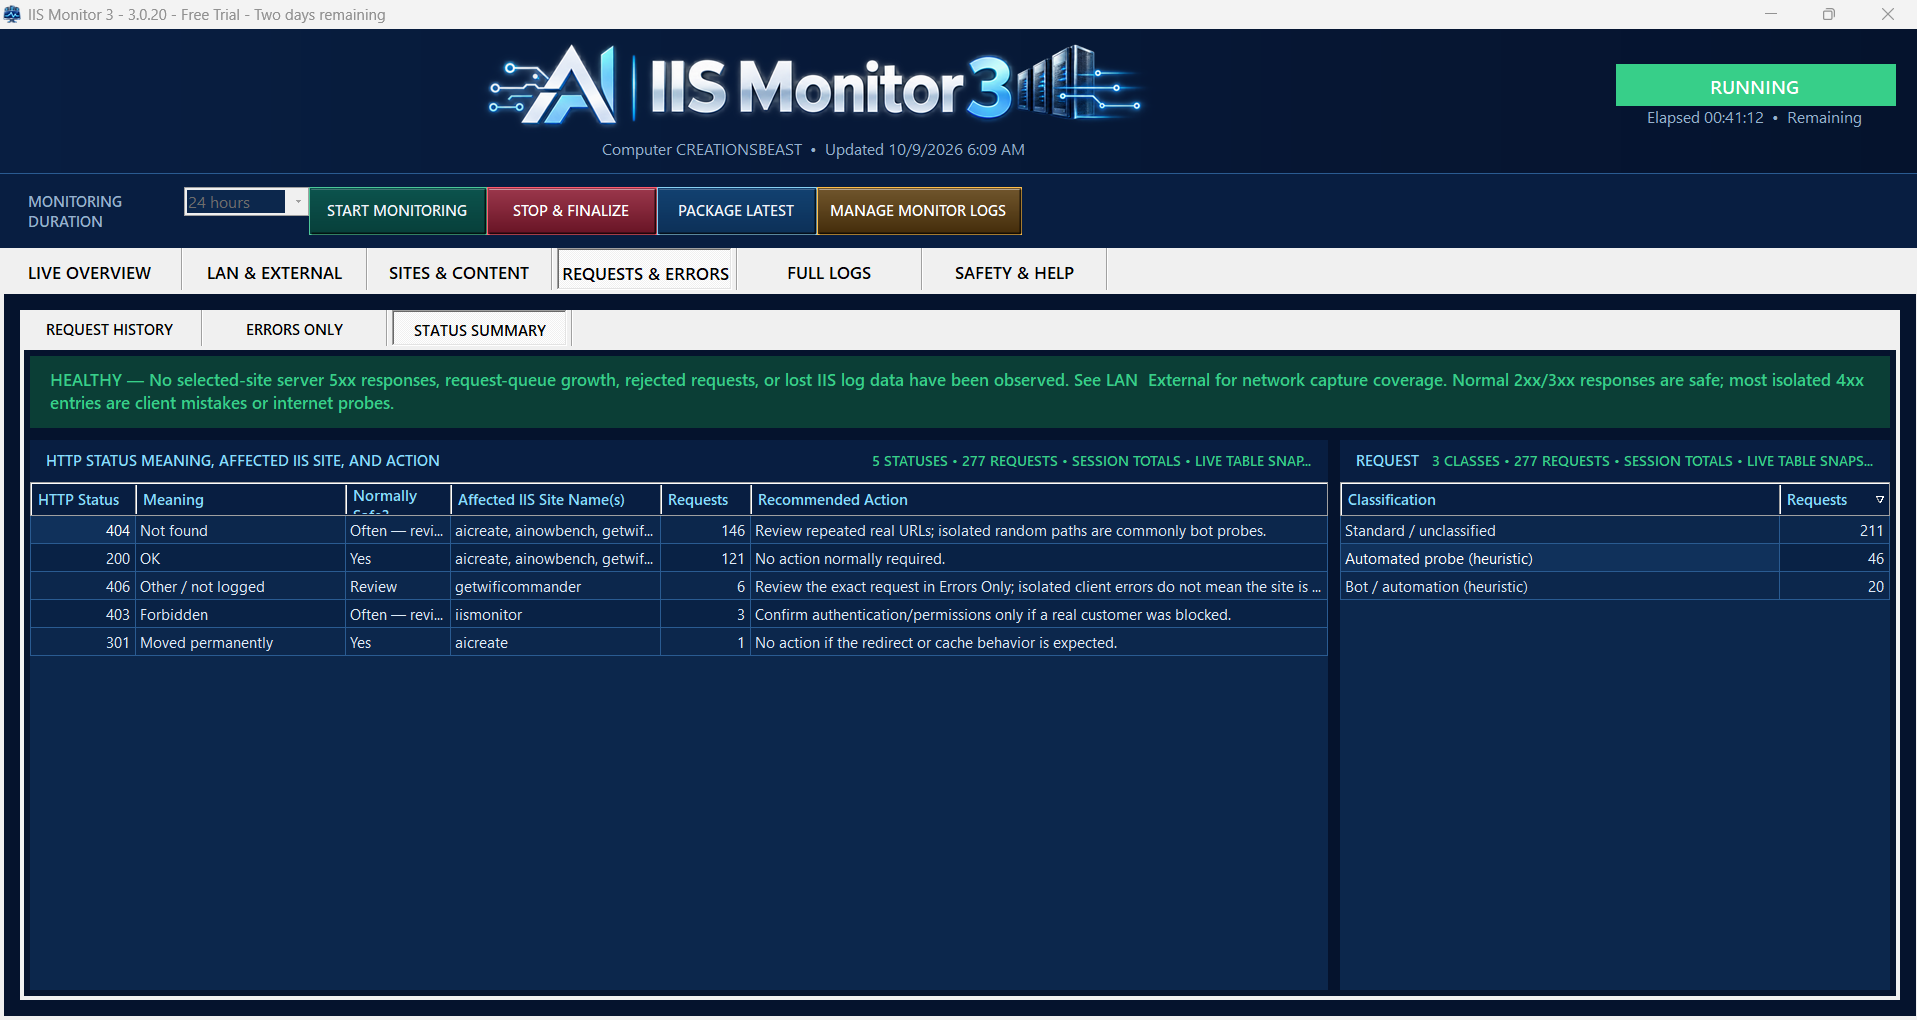
Status Summary
Understand HTTP status patterns and review plain-language guidance with heuristic request classifications.
TRIAL & ACTIVATION
Start your trial.
Activate on your terms.
The actual activation windows: start your two-day trial or enter a license key immediately. You can also activate after the trial expires.
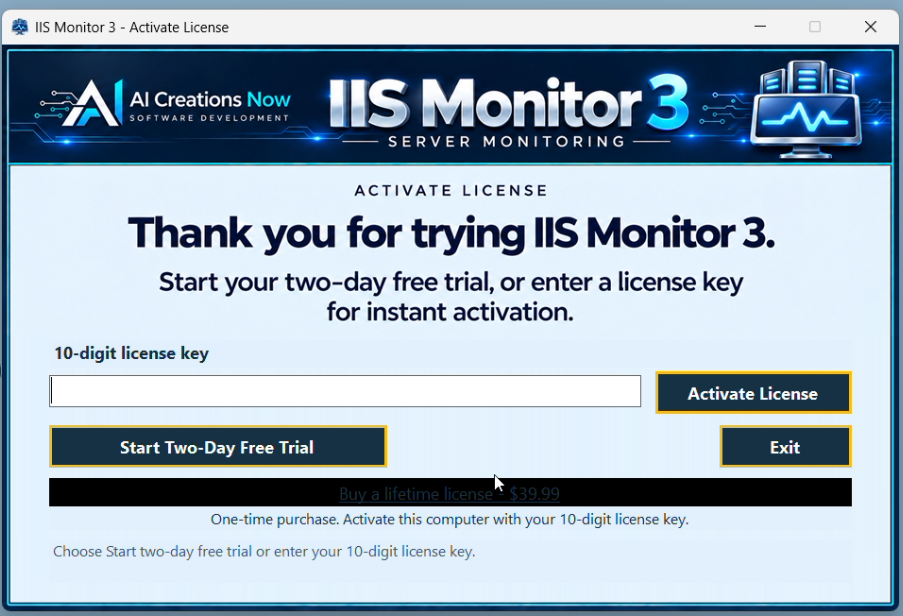
Start a trial or activate
Start your two-day free trial or activate immediately with a license key.
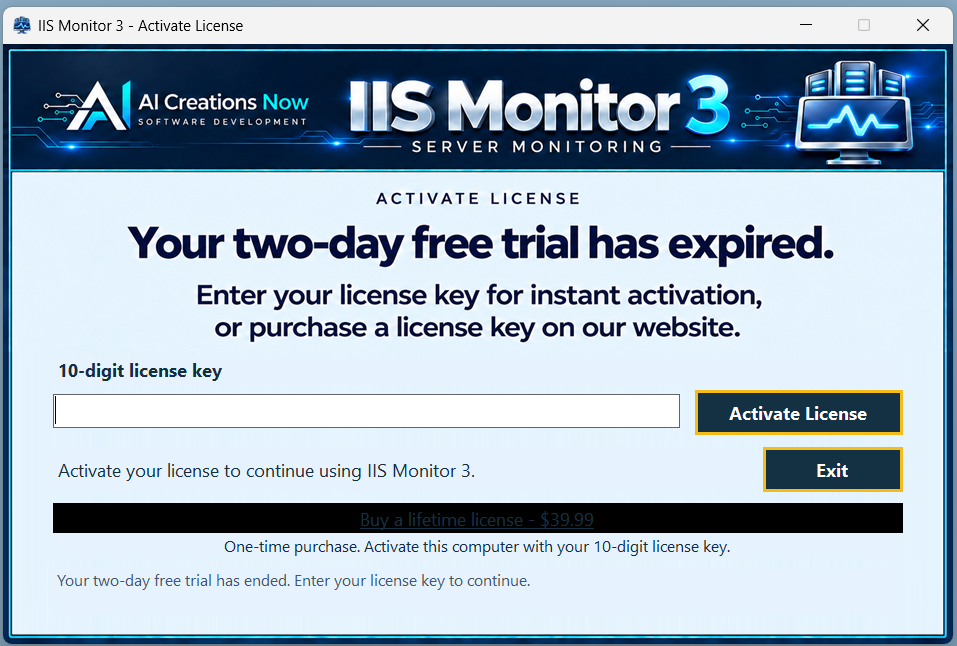
Activate after trial expiry
Trial expired: enter your license key to continue using IIS Monitor 3.
PRODUCT FILM
Meet IIS Monitor 3.
Plays muted while visible. Use the controls for sound or pause.